"Economic World History in One Chart":
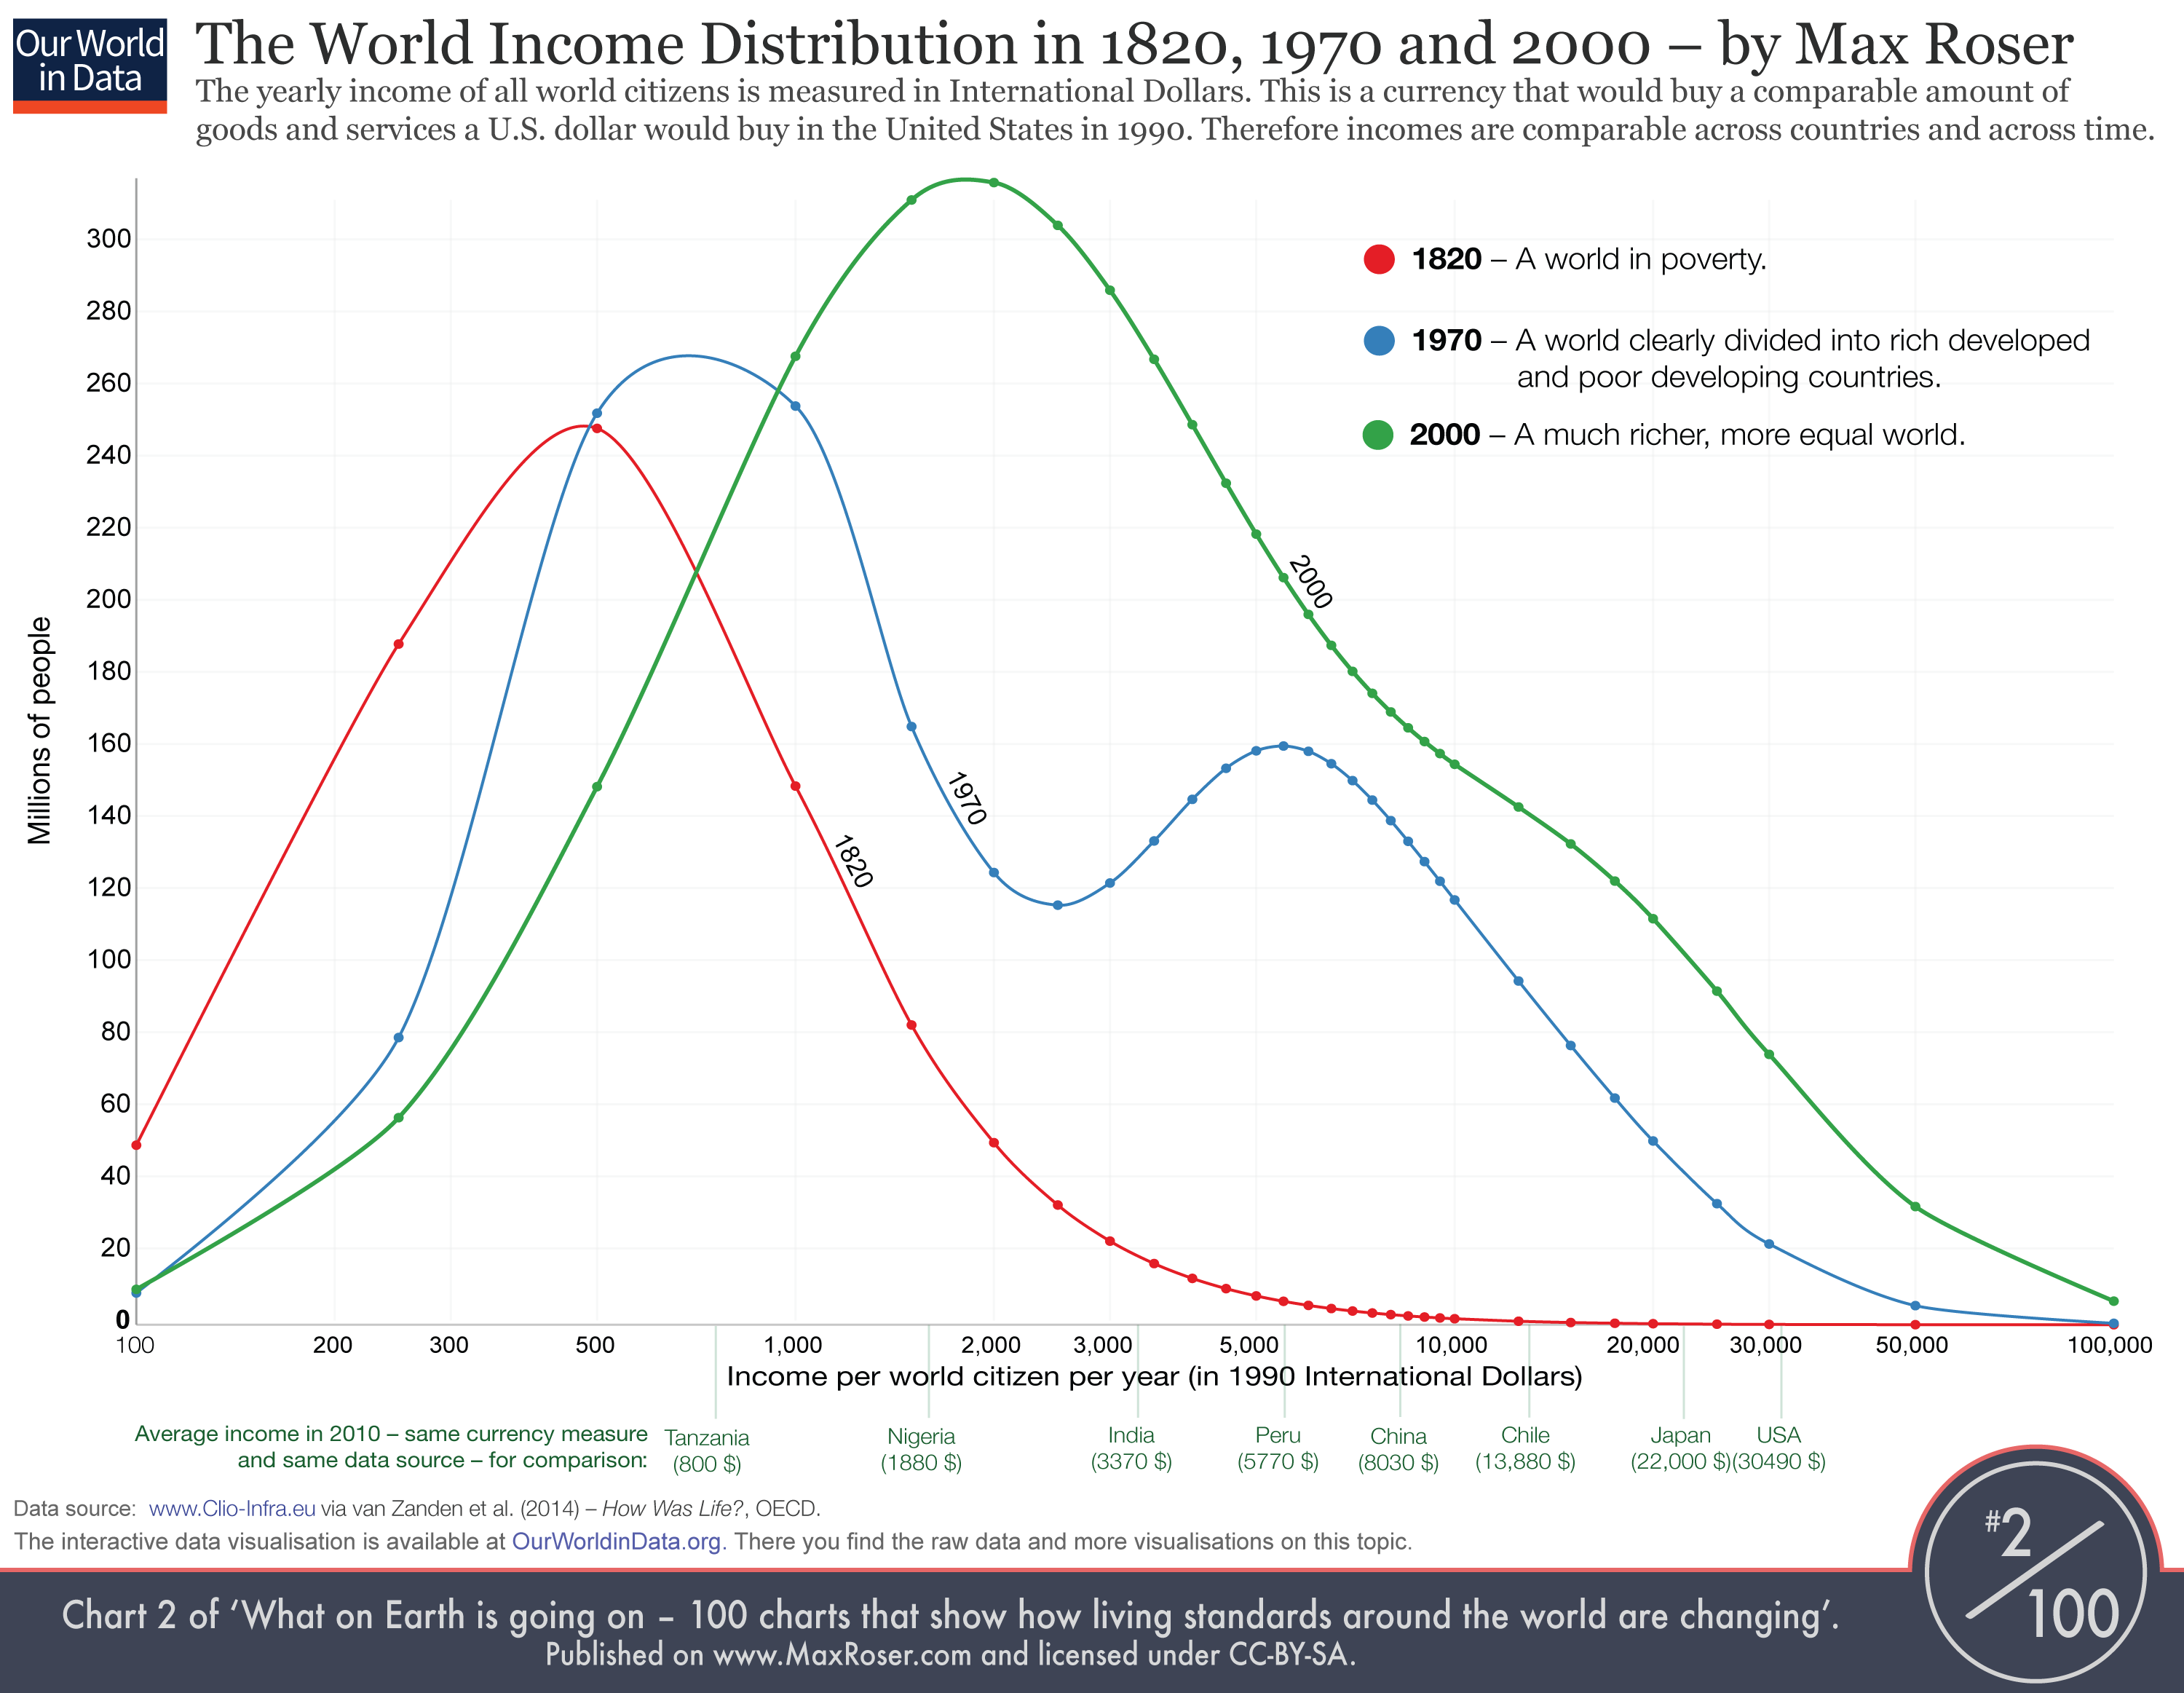
This chart shows the distribution of the annual income between all
world citizen. To make incomes comparable across countries and across
time the annual incomes are measured in International Dollars – this is a
currency that would would buy a comparable amount of goods and services
a U.S. dollar would buy in the United States in 1990.
The distribution of incomes is shown at 3 points in time:
- In 1820 only few countries achieved economic growth. The chart shows
that the majority of the world lived in poverty with an income similar
to the poorest countries in Africa today (around 500 International
Dollars).
- 150 years later in the year 1950 the world has changed – it became
very unequal. The world income distribution has the shape of a camel.
One hump at around 500 International Dollars and a second hump at around
5,000 International Dollars – the world was divided into a poor
developing world and a 10-times richer developed world.
- The world income distribution has changed dramatically over the
following 3 decades! The poorer countries, especially in South-East
Asia, have caught up. The two-humped camel shaped has changed into a
one-humped dromedar shape – the world is not divided in two anymore. And
not only is the world more equal again, the distribution has also
shifted to the right – the world is much richer!
(Click on image to see full size.)